The Fairmount FDS operator interface found on all control and annunciator panels features a large color graphical display that provides the canvas for displaying information. It indicates warning and alarm signals as well as provides a graphical user interface for acknowledging signals and performing maintenance and administrative functions.
The display has an intuitive modern interface similar to a smart phone or tablet with familiar multi-touch gestures including tap to select, swipe to scroll, and pinch to zoom. The advanced PCAP touch panel supports manipulation from a gloved hand and is resilient to water.
System Normal
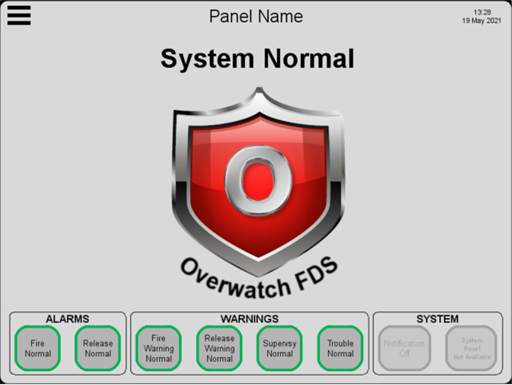
The image to the left shows the System Normal Screen that appears when there are no alarms or warnings in the FDS. Note the center ‘System Normal’ image can be customized for a particular installation.
Active Events
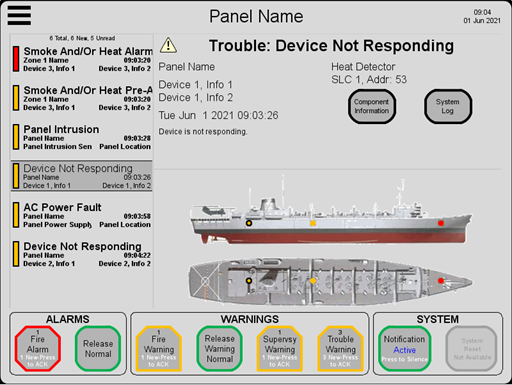
An example Active Events Screen shown to the right demonstrates the situational awareness capability and includes scrollable/selectable event list, event details, and system diagrams with location-based event overlay. The system diagram (the example shows a ship top/side view) can be customized to match the diagram for a particular installation.
The Active Events Screen includes the following elements:
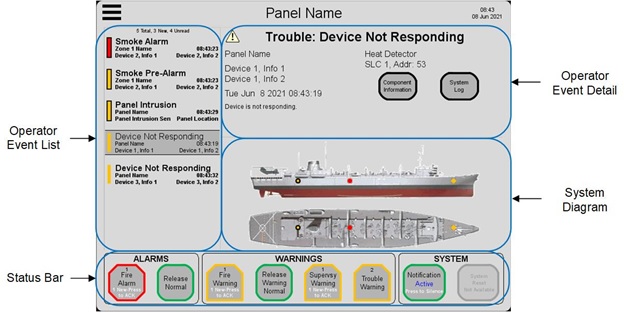
Operator Event List
- Sorted list with entries representing each active event in the FDS
- Collective accounting of events, operator ACKs, and read status
- Visual indication of operator interaction per event
Operator Event Detail
- Detailed information for selected event
- Quick link to component information or filtered system log messages
Status Bar
- Visual indication of active events by type
- Visual indication of operator acknowledgement by type
- Accounting of events by type with operator acknowledgement
System Diagram
- A user defined image of the fire detection system
- Colored pin indicators indicating the event category and physical location of each off-normal device in the system
- Visual indication of event selection and operator ACK by location
Diagnostics
System Menu
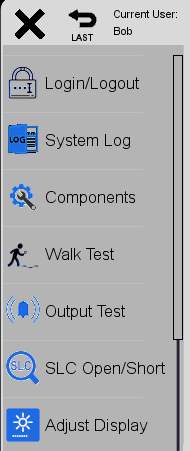
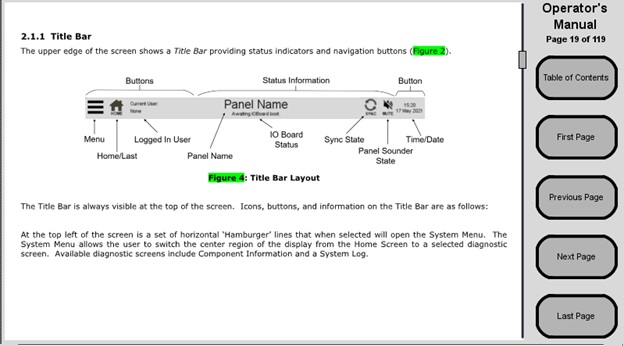
Pressing the ‘hamburger’ menu icon (top left) presents the operator with the System Menu. The System Menu allows the user to switch the center region of the display to the selected diagnostic screen. The menu is scrollable with a swipe up or down action to see additional selections. When displayed, a close ‘X’ icon is presented to collapse the menu.
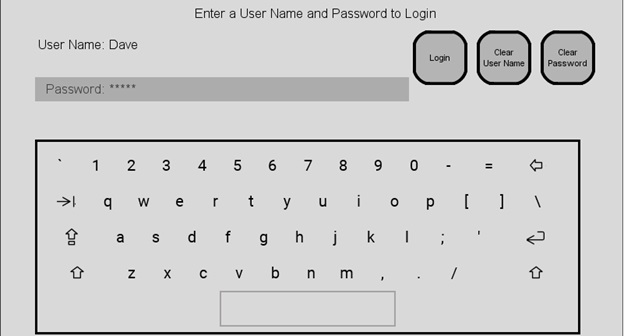
Login/Logout
Role Based Authentication Control (RBAC) allows the panel to be configured to protect various functionality by restricting access to only defined users with a right to that functionality. When RBAC is enabled, an operator must login with a user name and password to gain access and unlock the protected functionality.
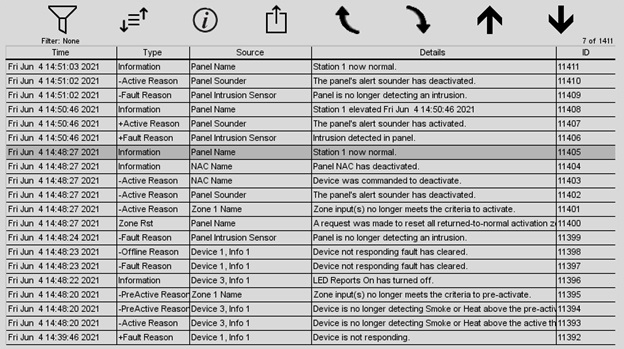
System Log
A 150,000-entry System Log provides a complete record of all activity throughout the FDS. Records are entered real-time as the panel processes the following:
- All event activity in the fire system (off-normal and return to normal events)
- Activation and deactivation operations per device and zone
- Operators logging in and out of panels
- User operations
- Activity on all other panels in the FDS. System logs on all panels in the FDS are synchronized to be identical.
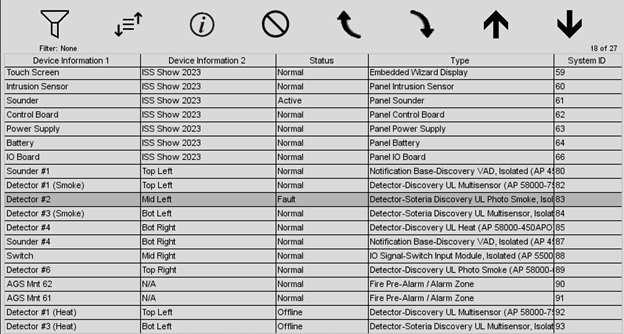
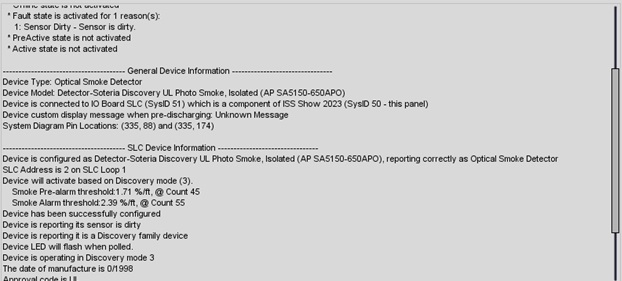
Component Information
A library of all the devices in the system is available in the Component Information screen. The screen displays the components in a scrollable list (first image below) with the ability to select an item and request additional detailed information (second image below).
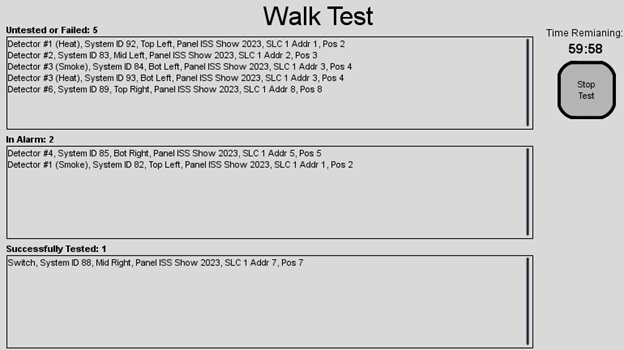
Walk Test
The Walk Test capability provides a mechanism to test the system’s sensors’ ability to detect a fire without warning and alarm notification and, if configured, suppression agent release. The Walk Test allows the operator to select one or more zones to test and includes a mechanism that keeps track of the sensors that successfully passed the test.
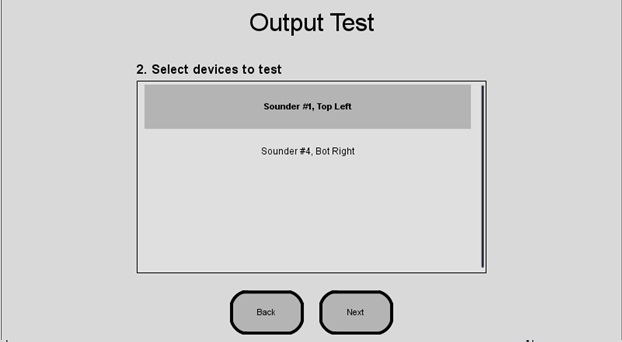
Output Test
The panel provides the capability to activate system outputs (notification devices, output modules, actuators, etc.) without the need to alarm.
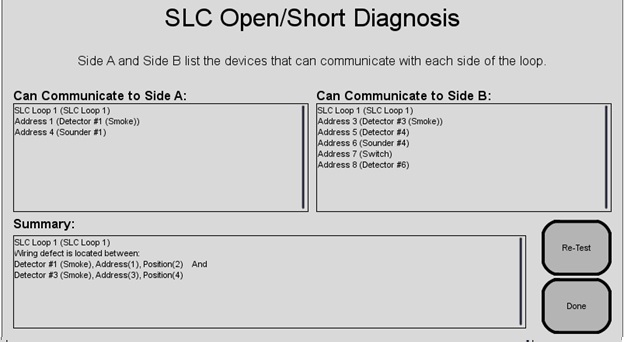
SLC Open/Short Diagnostics
If an SLC loop experiences a wiring fault, the Open/Short diagnostics can help locate the issue by determining which two devices the fault resides between.
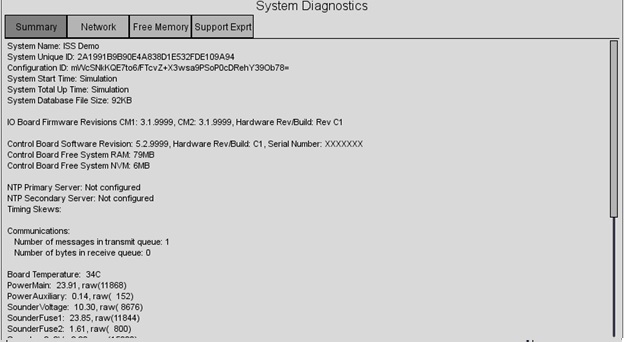
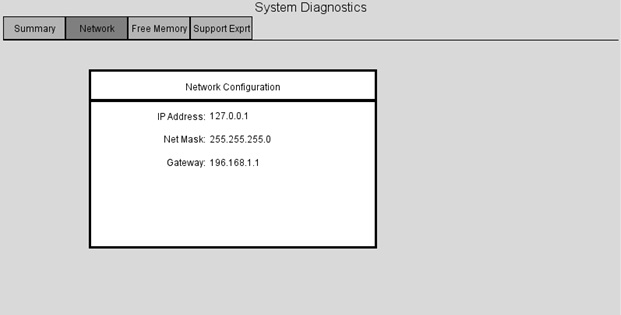
System Diagnostics
The System Diagnostics screen displays a host of information about the panel and its status including:
- Configuration Detail
- System Uptime
- Software Versions
- Power Supply Voltages and Internal Temperatures
- NTP Time Server Status
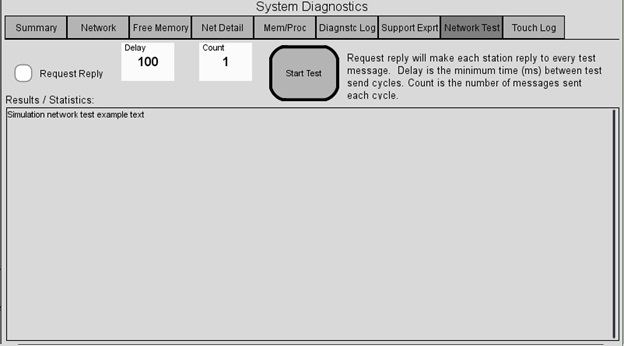
- Networking Setup and Tests
- Screens to Manually Configure the Ethernet Networking on Unconfigured Panels
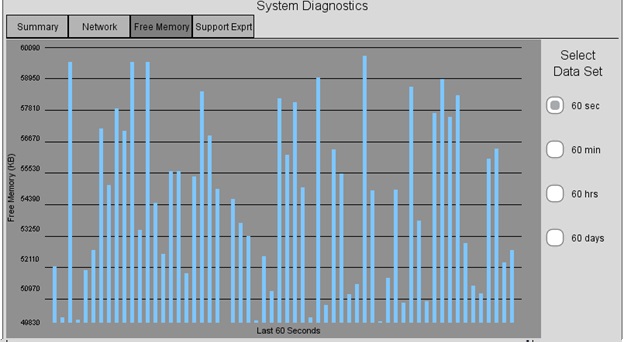
- System Free Memory over the last 60 seconds, 60 minutes, 60 hours, and 60 days
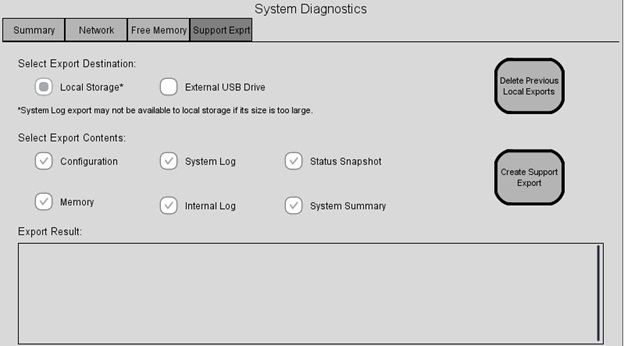
System Diagnostics also has the capability to create a support export package including configuration, state, diagnostic details, and logs from the panel that a can be used by technical support personnel to assist troubleshooting and resolving any issues that may occur.
Help
The interface includes an on-board abridged version of the Operator Manual to help guide the user through panel functionality if questions arise while at the panel.